
Lyme Disease in New York by County
By Bryan Rosner on May 2, 2008 in General News, Geographic Incidence
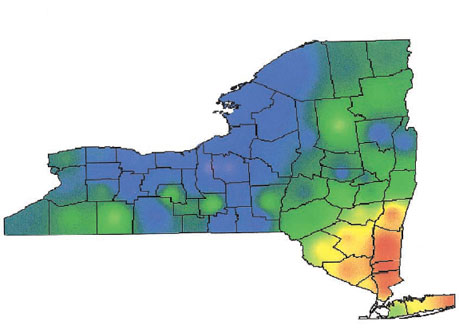
Today we are looking at Lyme disease cases in New York. These data are fascinating because New York has 2 of the 3 counties in the USA which have the HIGHEST rate of Lyme Disease in the ENTIRE USA! Yes, you heard that right – New York has areas with the most Lyme Disease density of anywhere in the country.
In order to appreciate just how much Lyme disease is in New York per county, first look at these statistics which show Lyme disease incidence in the USA per state. Then, below, you’ll find the incidence of Lyme disease in NY, broken down by county. You will be amazed when you compare the statistics and see just how much Lyme is in New York, especially the highest counties.
|
State
|
Incidence 2006*
(cases per
100,000
population)
|
|
Alabama
|
0.2
|
|
Alaska
|
0.4
|
|
Arizona
|
0.2
|
|
Arkansas
|
0.0
|
|
California
|
0.2
|
|
Colorado
|
0.0
|
|
Connecticut
|
51.0
|
|
Delaware
|
56.5
|
|
DC
|
10.7
|
|
Florida
|
0.2
|
|
Georgia
|
0.1
|
|
Hawaii
|
0.0
|
|
Idaho
|
0.5
|
|
Illinois
|
0.9
|
|
Indiana
|
0.4
|
|
Iowa
|
3.3
|
|
Kansas
|
0.1
|
|
Kentucky
|
0.2
|
|
Louisiana
|
0.0
|
|
Maine
|
25.6
|
|
Maryland
|
22.2
|
|
Massachusetts
|
22.2
|
|
Michigan
|
0.5
|
|
Minnesota
|
17.7
|
|
Mississippi
|
0.1
|
|
Missouri
|
0.1
|
|
Montana
|
0.1
|
|
Nebraska
|
0.6
|
|
Nevada
|
0.2
|
|
New Hampshire
|
46.9
|
|
New Jersey
|
27.9
|
|
New Mexico
|
0.2
|
|
New York
|
23.1
|
|
North Carolina
|
0.4
|
|
North Dakota
|
1.1
|
|
Ohio
|
0.4
|
|
Oklahoma
|
0.0
|
|
Oregon
|
0.2
|
|
Pennsylvania
|
26.1
|
|
Rhode Island
|
28.8
|
|
South Carolina
|
0.5
|
|
South Dakota
|
0.1
|
|
Tennessee
|
0.2
|
|
Texas
|
0.1
|
|
Utah
|
0.2
|
|
Vermont
|
16.8
|
|
Virginia
|
4.7
|
|
Washington
|
0.1
|
|
West Virginia
|
1.5
|
|
Wisconsin
|
26.4
|
|
Wyoming
|
0.2
|
|
U.S. TOTAL
|
8.24
|
| Lyme Disease Cases | Population | |||||
|---|---|---|---|---|---|---|
| Region/County | 2003 | 2004 | 2005 | Total | 2004 | Rate (cases per 100,000
population)
|
| Reg-1 Western New York | ||||||
| Allegany | 2 | 2 | 1 | 5 | 50,575 | 3.3 |
| Cattaraugus | 0 | 0 | 0 | 0 | 83,179 | 0.0 |
| Chautauqua | 1 | 2 | 3 | 6 | 137,267 | 1.5 |
| Erie | 1 | 1 | 10 | 12 | 936,318 | 0.4 |
| Genesee | 1 | 0 | 0 | 1 | 59,689 | 0.6 |
| Niagara | 3 | 1 | 0 | 4 | 218,060 | 0.6 |
| Orleans | 1 | 0 | 1 | 2 | 44,138 | 1.5 |
| Wyoming | 1 | 0 | 1 | 2 | 42,986 | 1.6 |
| Region Total | 10 | 6 | 16 | 32 | 1,572,212 | 0.7 |
| Reg-2 Finger Lakes | ||||||
| Chemung | 0 | 0 | 4 | 4 | 89,984 | 1.5 |
| Livingston | 2 | 0 | 1 | 3 | 64,819 | 1.5 |
| Monroe | 3 | 4 | 10 | 17 | 735,177 | 0.8 |
| Ontario | 1 | 2 | 2 | 5 | 103,504 | 1.6 |
| Schuyler | 1 | 0 | 0 | 1 | 19,505 | 1.7 |
| Seneca | 2 | 0 | 2 | 4 | 35,075 | 3.8 |
| Steuben | 0 | 0 | 1 | 1 | 98,814 | 0.3 |
| Wayne | 0 | 0 | 0 | 0 | 93,861 | 0.0 |
| Yates | 1 | 0 | 0 | 1 | 24,669 | 1.4 |
| Region Total | 10 | 6 | 20 | 36 | 1,265,408 | 0.9 |
| Reg-3 Central New York | ||||||
| Cayuga | 0 | 0 | 2 | 2 | 81,916 | 0.8 |
| Cortland | 0 | 0 | 1 | 1 | 49,006 | 0.7 |
| Herkimer | 2 | 2 | 2 | 6 | 63,858 | 3.1 |
| Jefferson | 1 | 1 | 2 | 4 | 111,467 | 1.2 |
| Lewis | 0 | 0 | 0 | 0 | 26,564 | 0.0 |
| Madison | 4 | 3 | 3 | 10 | 70,407 | 4.7 |
| Oneida | 2 | 1 | 5 | 8 | 234,962 | 1.1 |
| Onondaga | 7 | 11 | 10 | 28 | 459,805 | 2.0 |
| Oswego | 4 | 3 | 0 | 7 | 123,776 | 1.9 |
| St Lawrence | 4 | 2 | 2 | 8 | 111,306 | 2.4 |
| Tompkins | 10 | 5 | 3 | 18 | 100,135 | 6.0 |
| Region Total | 34 | 28 | 30 | 92 | 1,433,202 | 2.1 |
| Reg-4 New York-Penn | ||||||
| Broome | 5 | 5 | 11 | 21 | 197,696 | 3.5 |
| Chenango | 0 | 0 | 1 | 1 | 51,861 | 0.6 |
| Tioga | 3 | 3 | 1 | 7 | 51,535 | 4.5 |
| Region Total | 8 | 8 | 13 | 29 | 301,092 | 3.2 |
| Reg-5 Northeastern New York | ||||||
| Albany | 99 | 226 | 307 | 632 | 298,432 | 70.6 |
| Clinton | 9 | 5 | 5 | 19 | 81,875 | 7.7 |
| Columbia | 904 | 404 | 362 | 1,670 | 63,668 | 874.3 |
| Delaware | 0 | 2 | 6 | 8 | 47,328 | 5.6 |
| Essex | 1 | 2 | 1 | 4 | 38,901 | 3.4 |
| Franklin | 1 | 0 | 1 | 2 | 51,009 | 1.3 |
| Fulton | 0 | 1 | 2 | 3 | 55,463 | 1.8 |
| Greene | 119 | 99 | 121 | 339 | 49,195 | 229.7 |
| Hamilton | 0 | 1 | 0 | 1 | 5,227 | 6.4 |
| Montgomery | 1 | 2 | 3 | 6 | 49,283 | 4.1 |
| Otsego | 2 | 1 | 0 | 3 | 62,518 | 1.6 |
| Rensselaer | 157 | 200 | 208 | 565 | 154,077 | 122.2 |
| Saratoga | 11 | 42 | 69 | 122 | 212,706 | 19.1 |
| Schenectady | 13 | 17 | 26 | 56 | 148,042 | 12.6 |
| Schoharie | 2 | 2 | 4 | 8 | 32,012 | 8.3 |
| Warren | 0 | 9 | 12 | 21 | 65,147 | 10.7 |
| Washington | 5 | 17 | 22 | 44 | 62,807 | 23.4 |
| Region Total | 1,324 | 1,030 | 1,149 | 3,503 | 1,477,690 | 79.0 |
| Reg-6 Hudson Valley | ||||||
| Dutchess | 1,283 | 1,076 | 1,398 | 3,757 | 293,395 | 426.8 |
| Orange | 587 | 518 | 536 | 1,641 | 370,352 | 147.7 |
| Putnam | 303 | 205 | 191 | 699 | 100,570 | 231.7 |
| Rockland | 196 | 167 | 254 | 617 | 293,626 | 70.0 |
| Sullivan | 15 | 39 | 36 | 90 | 76,110 | 39.4 |
| Ulster | 300 | 295 | 400 | 995 | 181,779 | 182.5 |
| Westchester | 746 | 746 | 458 | 1,950 | 942,444 | 69.0 |
| Region Total | 3,430 | 3,046 | 3,273 | 9,749 | 2,258,276 | 143.9 |
| Reg-7 New York City | ||||||
| Bronx | 20 | 28 | 27 | 75 | 1,365,536 | 1.8 |
| Kings | 44 | 60 | 71 | 175 | 2,475,290 | 2.4 |
| New York | 108 | 190 | 225 | 523 | 1,562,723 | 11.2 |
| Queens | 41 | 42 | 46 | 129 | 2,237,216 | 1.9 |
| Richmond | 12 | 37 | 31 | 80 | 463,314 | 5.8 |
| Region Total | 225 | 357 | 400 | 982 | 8,104,079 | 4.0 |
| Reg-8 Nassau-Suffolk | ||||||
| Nassau | 75 | 59 | 122 | 256 | 1,339,641 | 6.4 |
| Suffolk | 288 | 561 | 542 | 1,391 | 1,475,488 | 31.4 |
| Region Total | 363 | 620 | 664 | 1,647 | 2,815,129 | 19.5 |
| New York State Total | 5,404 | 5,101 | 5,565 | 16,070 | 19,227,088 | 27.9 |
If you would like more info on Lyme in New York, check out the New York Lyme Support Group moderated by Joseph Burrascano, M.D.:
This map shows the incidence and statistics in New York, with red being the highest rates: